Result
The result part is used to visualize deviation of chromosome numbers compared to at regular genome.
Plots
Normalized Coverage
The normalized coverage plot show deviations from regular chromosome coverage, and can indicates changes in chromosome numbers when the value deviates from 1. The example plot contain samples with trisomy 13,18 and 21.
NCV 13 vs Fetal fraction
Plot used to visualise NCV 13 vs Fetal fraction.
- Points on the right side of the red line are positiv for Trisomy 13.
- points in the red zone have uncertain status.
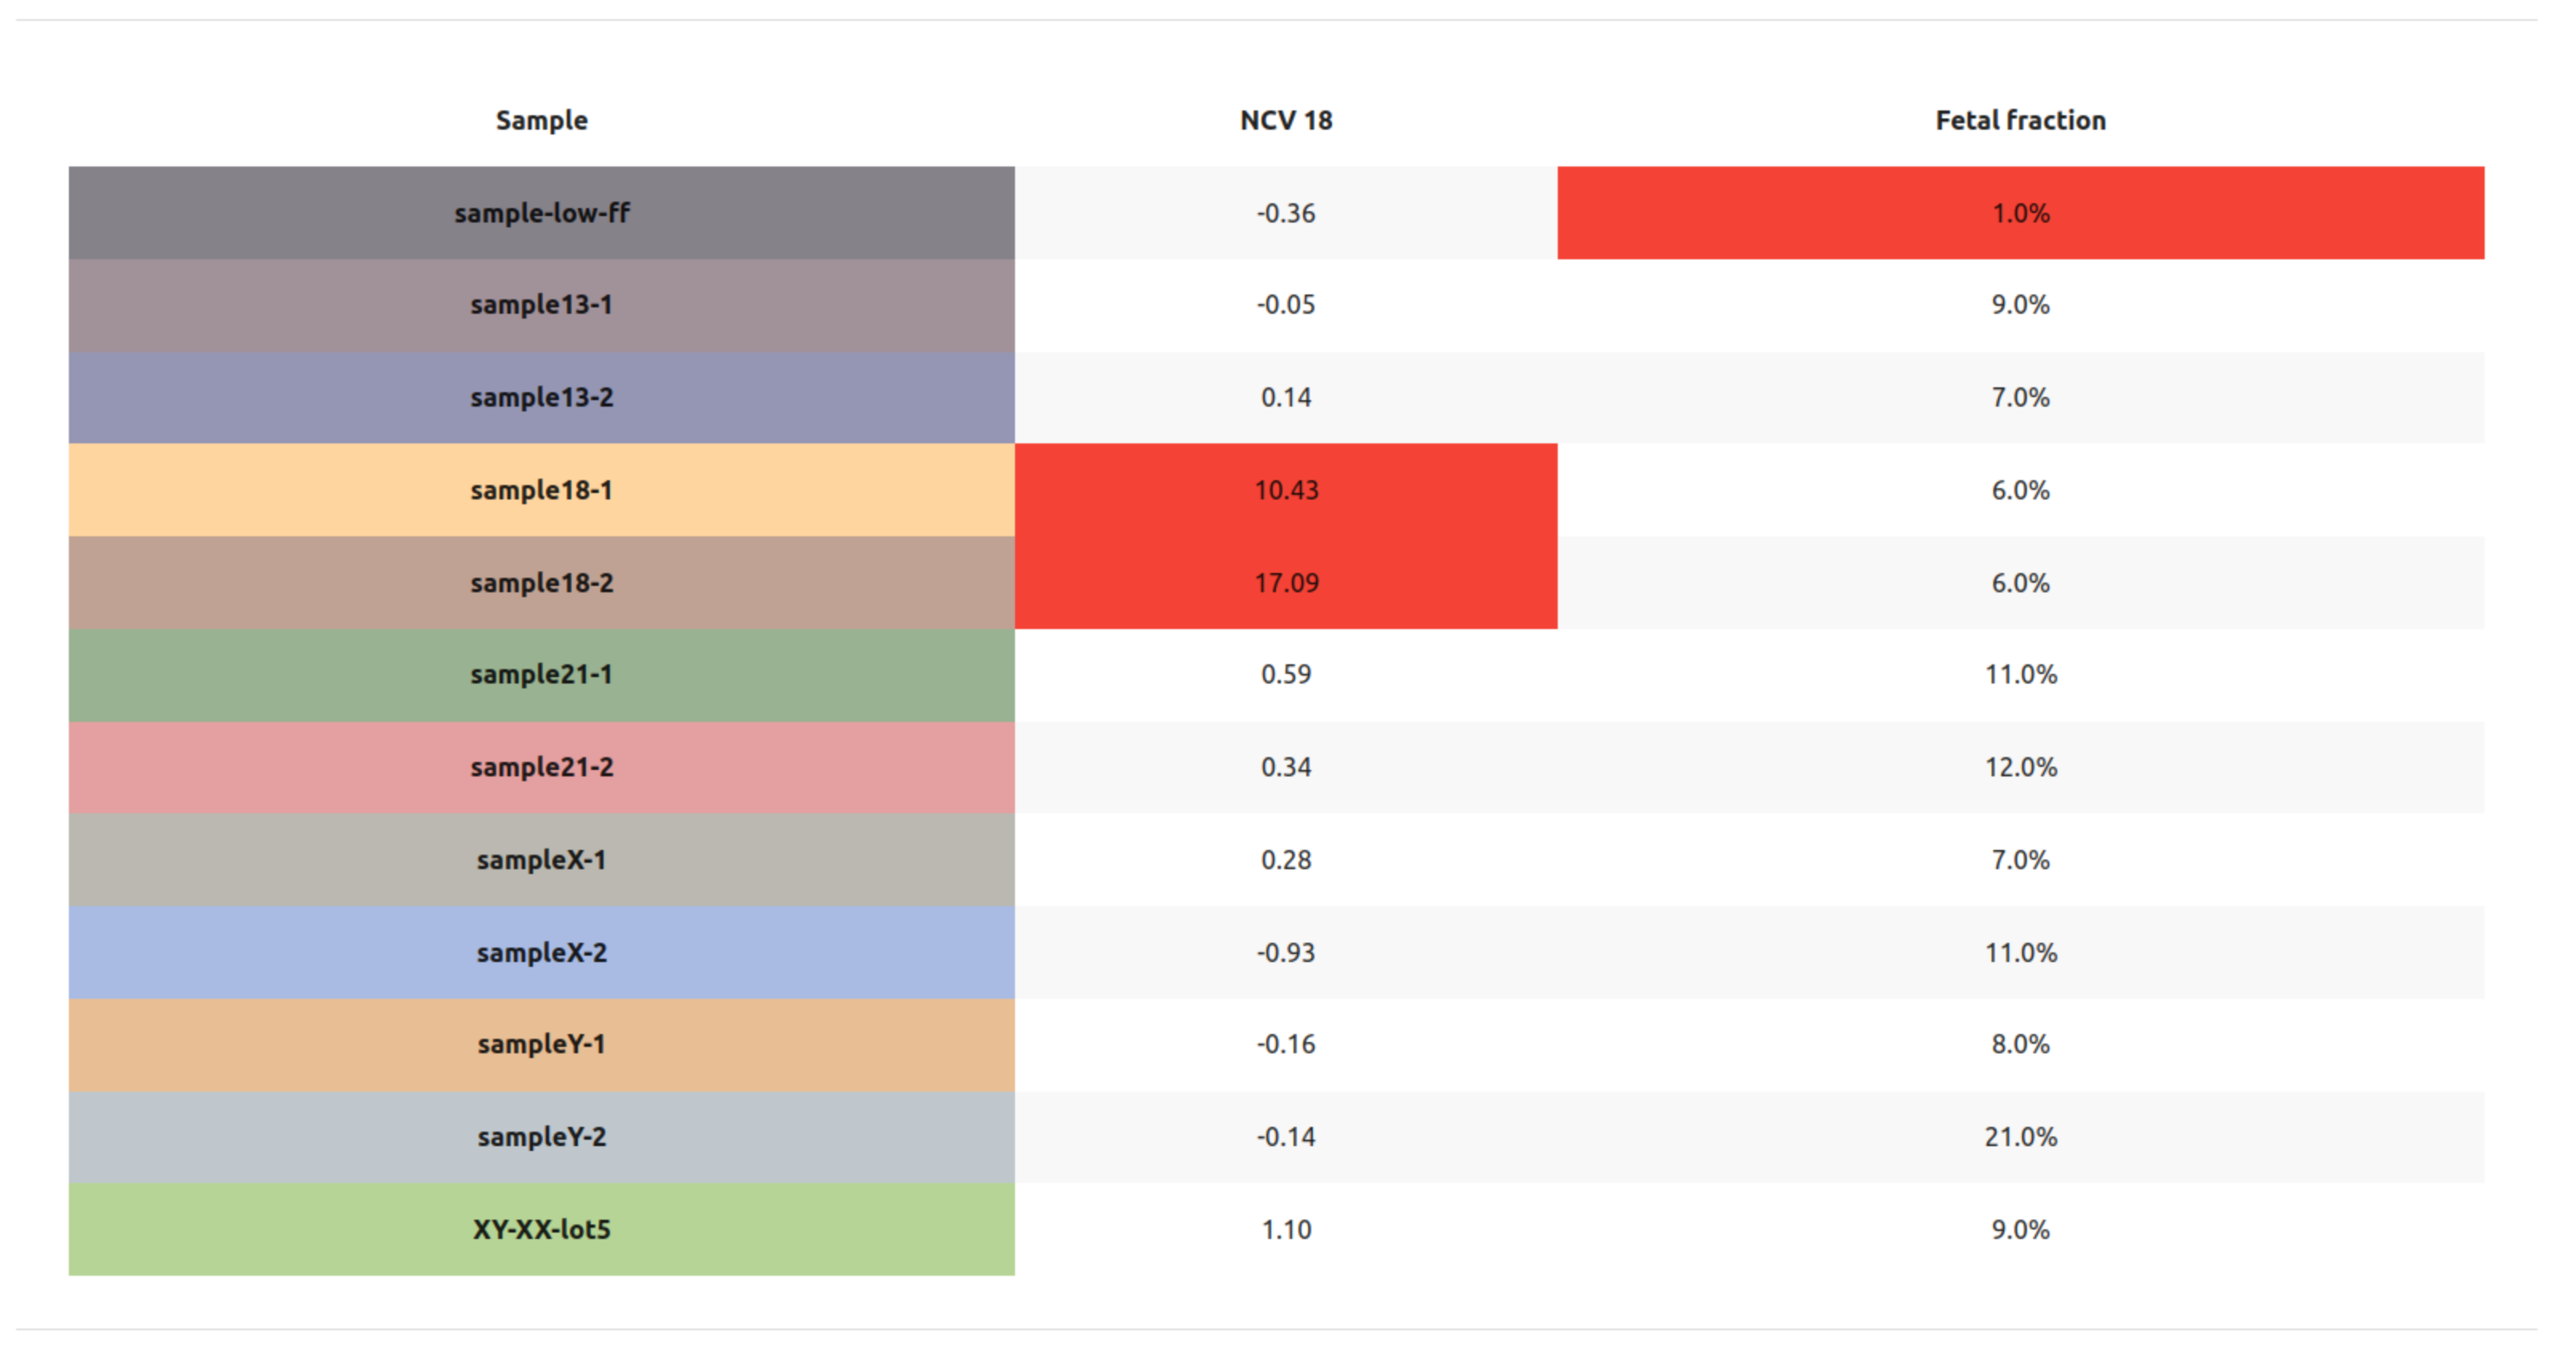
NCV 18 vs Fetal fraction
Plot used to visualise NCV 18 vs Fetal fraction.
- Points on the right side of the red line are positiv for Trisomy 18.
- Points in the red zone have uncertain status.
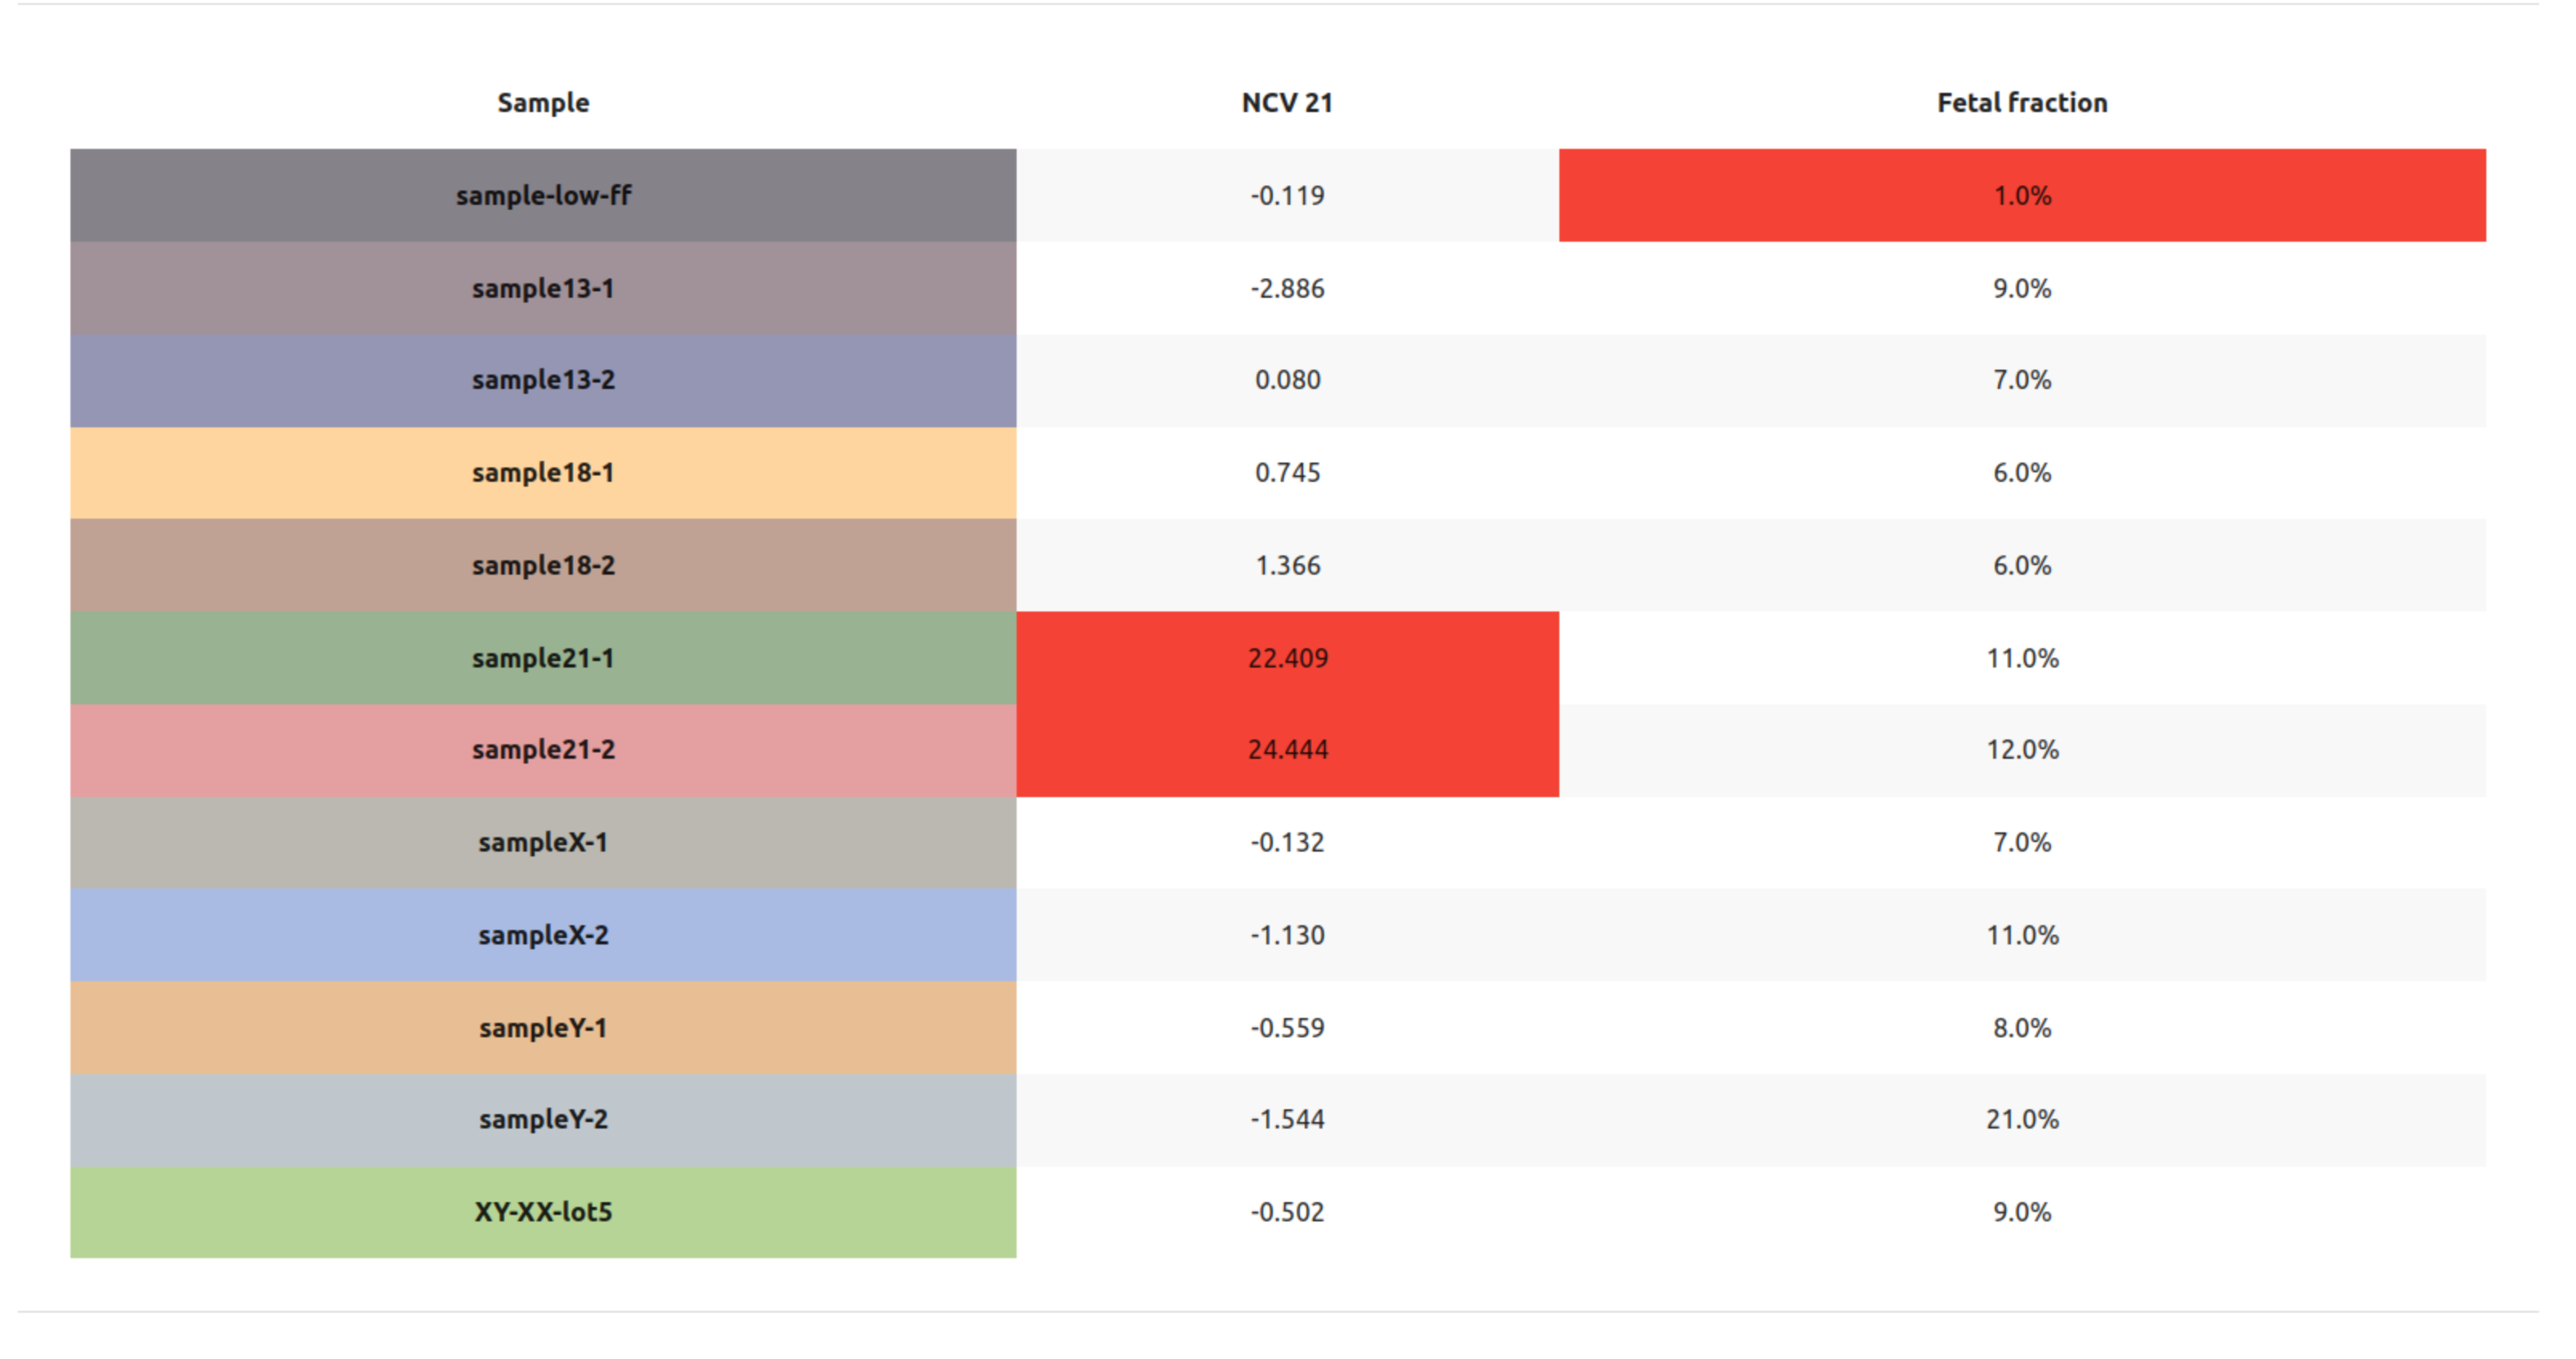
NCV 21 vs Fetal fraction
Plot used to visualise NCV 21 vs Fetal fraction.
- Points on the right side of the red line are positiv for Trisomy 21.
- Points in the red zone have uncertain status.
NCV X vs NCV Y
Plot used to visualise NCV X vs NCV Y.
NCV X vs Fetal fraction
Plot used to visualise NCV X vs Fetal fraction
NCV Y vs Fetal fraction
Plot used to visualise NCV Y vs Fetal fraction
Tables
Tables with the actual values for NCV and fetal fraction are generated, where values that should be looked at more thoroughly are highlighted with red.
- Low fetal fraction samples
- High NCV values
Overview table

Per metric table